


Wither Consumer Confidence?
The critical index jumped in December. Biden needs it to jump higher. Will it?

December brought at least one piece of excellent economic news for Joe Biden. Consumer Confidence, after slumping all autumn, rebounded with a vengeance.
The University of Michigan Index of Consumer Sentiment jumped 8.4 points from 61.3 in November to 69.7 in December. This was the index’s biggest jump since a 9.9-point rise in December 2005. (The Conference Board’s consumer confidence index showed similar results.)
The bad news for Biden is that the index is still at levels that have meant disaster for incumbent presidents. As I wrote in May, the incumbent party has not won a presidential race in more than 40 years when this index was below 75. In fact Barack Obama in 2012 is the only incumbent to win re-election in that time with this index below 90 (79.4).
I expect I will be writing about consumer confidence periodically this year, because it has been such a strong indicator of modern presidential elections. And it makes intuitive sense: When people feel good about the economy, they give a lot of credit (too much) to the President and will not be eager to kick him out.
As I discussed in July, the last time consumer confidence jumped, consumer sentiment usually doesn’t swing dramatically for several months in a row. A sharp rise is likely to be followed by a pullback. The index already had defied gravity, jumping 5.2 points in June and another 7.3 in July, up to 71.5.
Then gravity asserted itself. The index dropped 10 points over the next four months. December was the first increase since July. And for four months, Democrats like me have been whining it’s not fair. When you say you’re not happy, American Consumer, you’re wrong. You can imagine how well that arrogant argument has been received.
But we Biden supporters aren’t imaging things. Here is a chart that compares the University of Michigan’s Index of Consumer Sentiment with where it should be. I’ll explain what I mean by “should be” in a moment. But first, let’s look at the chart.
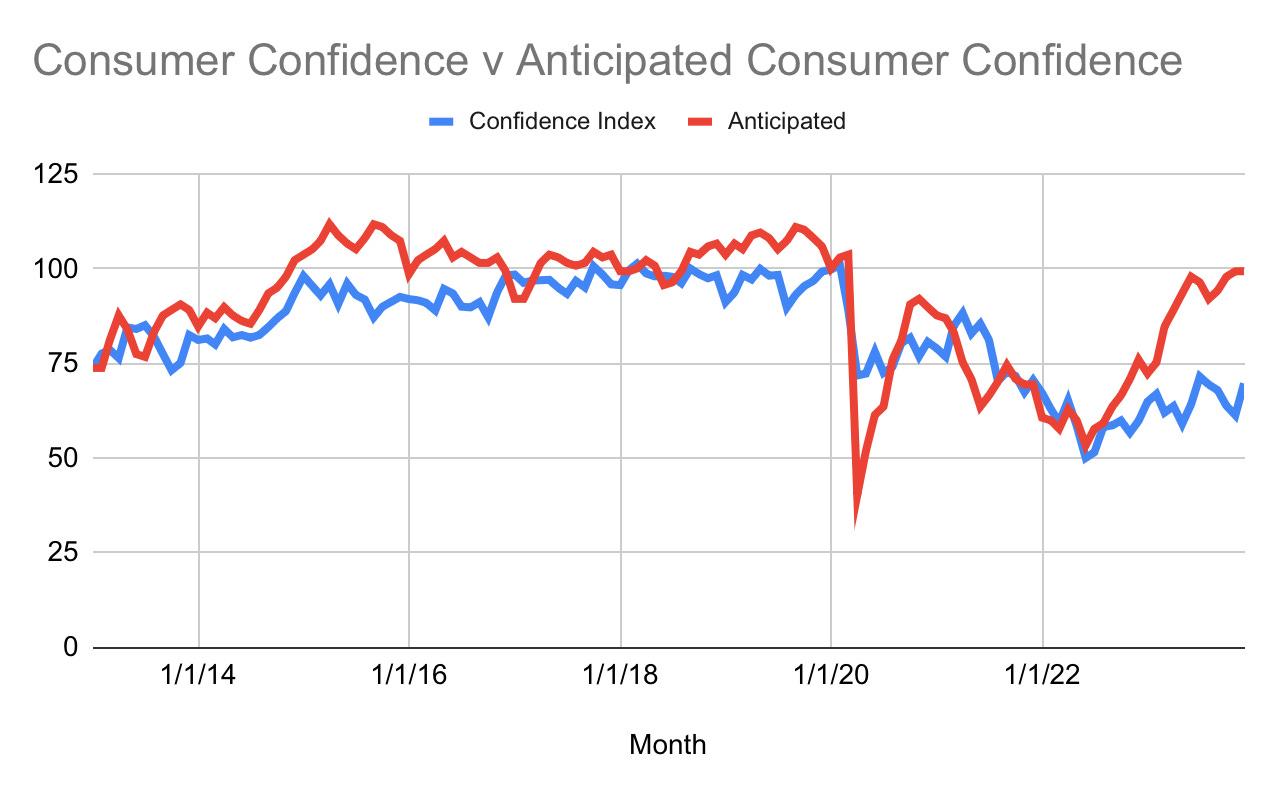
The “should be” red line, which I call Anticipated, is based on what is known as The Misery Index - inflation and unemployment. In the world of economics, the math doesn’t get any simpler. You just add the unemployment rate and inflation, measured by the rise in the Consumer Price Index. For November, the Bureau of Labor Statistics reported the CPI rose 3.1 points, and unemployment was at 3.5%. That’s a Misery Index of 6.6 - very low by the standards of the last 50 years, but it’s been low for a while. A decade ago, it was 8. In 2019, when Trump’s economy was really cooking, it was below 6 the entire year.
I did some arithmetic acrobatics to convert the Misery Index into a line that would generally track the Index of Consumer Sentiment. (If you’re interested, I explain my methodology at the end of this article.)
As you can see, there are three places on the chart where the lines diverge significantly:
Near the end of Obama’s presidency, 2015-16. The two lines start to come together as Election Day 2016 approaches and stay together for the first half of the Trump presidency. I’m not sure what caused this gap.
In early 2020, consumer confidence tumbles, but not as much as the Anticipated line. The Anticipated line does a Wile E. Coyote off a cliff. That’s the start of COVID. The economy shut down; unemployment skyrocketed. The Confidence Index fell, but the consumer response was softened a bit by hope that 1) the economy would get moving again soon and 2) the government would provide some relief.
Then, in early 2022, the lines diverge again and have remained apart. What’s going on here? Pundits have cited many factors, but the headline is inflation scared the heck out of people. It jumped in 2021 to a peak of 9.1% in June 2022, a level not seen in a couple of generations. From there, the decline has been gradual but steady, down to 3.1% in November, the latest month reported.
Consumers aren’t quite ready to believe that we’ve tamed inflation, so the Confidence Index isn’t where it “should be.” Can you blame them? A year or so after the stock market crash in 1987, Newsday columnist Robert Reno described the shattered investor psyche this way: If you’ve ever been in a falling elevator, you never again step into an elevator with the same level of confidence. The shock that consumers felt in 2021-22 wasn’t as dramatic as the 1987 crash. But it was more widespread. And the shock doesn’t go away after just a few months of good news.
With each passing month of decelerating price hikes and increasing wage bumps, consumers relax a little more. Not all of them - if you’re looking to buy your first home, you probably still feel pretty miserable. If Biden can avoid any shocks to the system that spike prices or tip the current soft landing into a recession - a big if - consumer confidence should continue to climb.
There are at least two other reasons to believe the Index of Consumer Sentiment will be higher by summer, when voters will start to pay closer attention to politics.
First, look at the components of the Index. The University of Michigan breaks the index into a rating of current economic conditions and a rating of expectations. The current conditions part in December was 73.3, up 23% from a year ago. The expectations part was 67.4, up only 12.3%.
Consumers believe the economy has improved, but they’re not quite convinced it’s going to continue to get better. That’s an opportunity for Biden. Every month of low inflation and steady job growth sort of counts double. Consumers not only will feel a little better about current conditions, they will feel a lot better about the future, as they worry less and less of an inflation relapse.
Second, New York Times columnist Paul Krugman and others have noted that consumers might not say they’re happy - but they’re increasingly acting like they’re happy. Holiday spending rose a modest but solid 3.1%, including a 7.8% gain in restaurant sales. You don’t see an 8% jump in dining out if consumers are worried.
Maybe the Index of Consumer Sentiment is a lagging indicator of sorts; people will feel and act confident before they’ll commit to saying it out loud.
If you’re trying to compare The Misery Index with Consumer Sentiment on a chart, you have two problems - scale and direction.
The scale problem: The Consumer Sentiment numbers range from 50 to about 100. The Misery Index is generally between 5 and 10. A 1 point change in Consumer Sentiment is hardly noticeable. A 1 point change in the Misery Index is a big deal. So you have to make the Misery and Consumer Sentiment numbers comparable.
The direction problem: An increase in Consumer Sentiment is good; an increase in the Misery Index is bad. On a chart, you want changes in the indexes to mean the same thing. You want a rise in the Misery Index line and a rise in the Consumer Sentiment line to both mean good news.
So here’s what I did. I started with the first month, January 2013. The actual Consumer Sentiment Index was 73.8. The Misery Index was 10.1. I wanted to make them the same. So I multiplied the January 2013 Misery Index by 7.3069. That became my Misery Index multiplier; I multiplied every monthly Misery Index by 7.3069. That solves the scale problem. Call that the Adjusted Misery Index.
How do you make a decrease in the Misery Index look like a good thing? You subtract it from something. The “something” in this case was the first month’s Consumer Sentiment Index = 73.8. The arithmetic is 73.8 + 73.8 - that month’s Adjusted Misery Index. The result is what I called the Anticipated Index.
The first 73.8 sets the height of the Anticipated Index to match the first January 2013 month’s Consumer Sentiment Index. Imagine the Adjusted Misery Index dropped to 70.8 the next month. Then you’d get an Anticipated Index of 73.8 + 73.8 - 70.8 = 76.8. In other words, you’d expect the Consumer Sentiment Index to rise 3 points to 76.8.
Let’s compare the chart’s start and end points. The Misery Index dropped from 10.1 in January 2013 to 6.6 in December 2023. So you’d expect the Consumer Sentiment Index to be much higher at the end. How much higher? The arithmetic says 99.4, or 25.6 points higher than it was in January 2013. Instead, it’s actually lower - 69.7. That’s a massive 29.7 point gap.
Imagine if the economy in November 2024 is exactly as good as today, measured by the Misery Index. If only half the gap between the Consumer Sentiment Index and what it “should be” disappeared, the Consumer Sentiment Index would rise to about 84-85. That’s comfortably higher than the 79.4 November 2012, when Obama was re-elected. My guess is that would be more than enough for Biden to win re-election.